Chapter 8
• Cookies
This video is discussed the 3 ways to authenticate users in PHP. You can use this to help you to code for the login in your website.
• Cookies
This video is discussed the 3 ways to authenticate users in PHP. You can use this to help you to code for the login in your website.
• HTTP cookies
• PHP session
This video described the usefulness and implementation of the cookies and sessions in a website.
• Basic MySQL
• RDBMS
• MySQL with PHP
• Execute queries
This video is discuss on how to work with data in PHP. You can manipulate your data stored in the database by using SQL.
• Array
• Multidimensional Array
• Function without parameter
This video is about an introduction on how to code in PHP. In this video you will learn array in PHP such as array syntax, array function, manipulating array values and so on.
a) HTML
• Testing and configuration
• Redirecting and formatting
• Validating, encoding and decoding
• String manipulation
This video is about an introduction on how to code in PHP. In this video you will learn to use PHP’s function that are very useful for the development of a website.
• PHP scripting
• Basic scripting
• Decision structure
• Iteration control structure
• User define function
This video is about an introduction on how to code in PHP. The basic in PHP scripting such as basic syntax, control structure, iteration and user defined function.
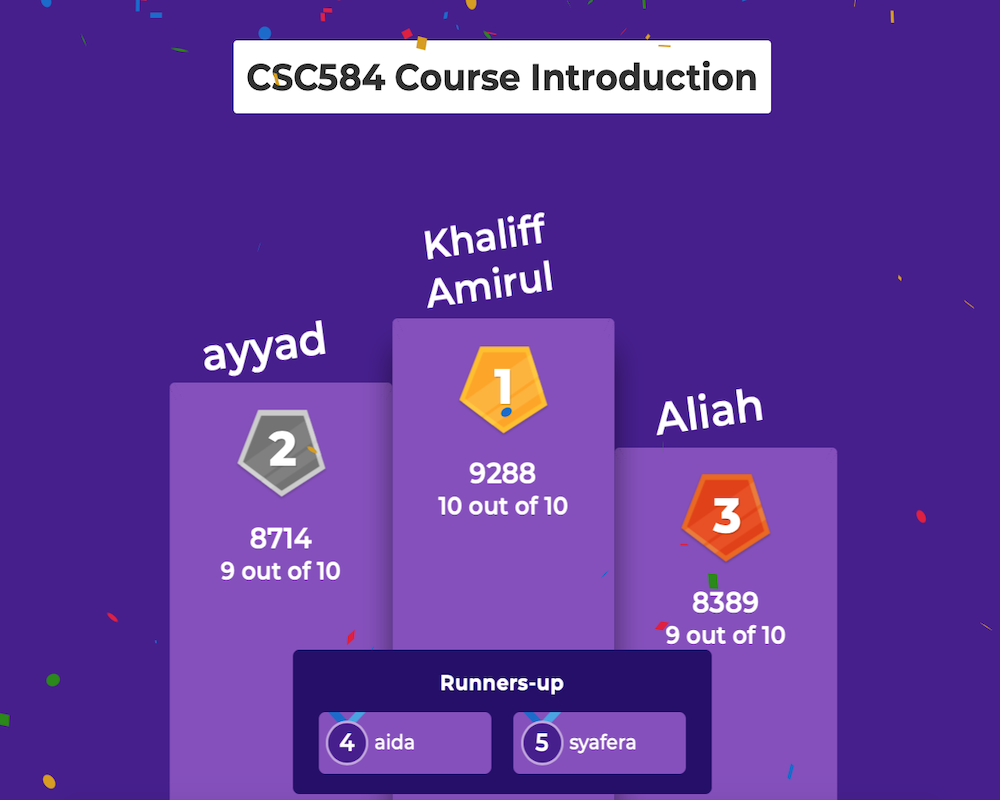
Course introduction
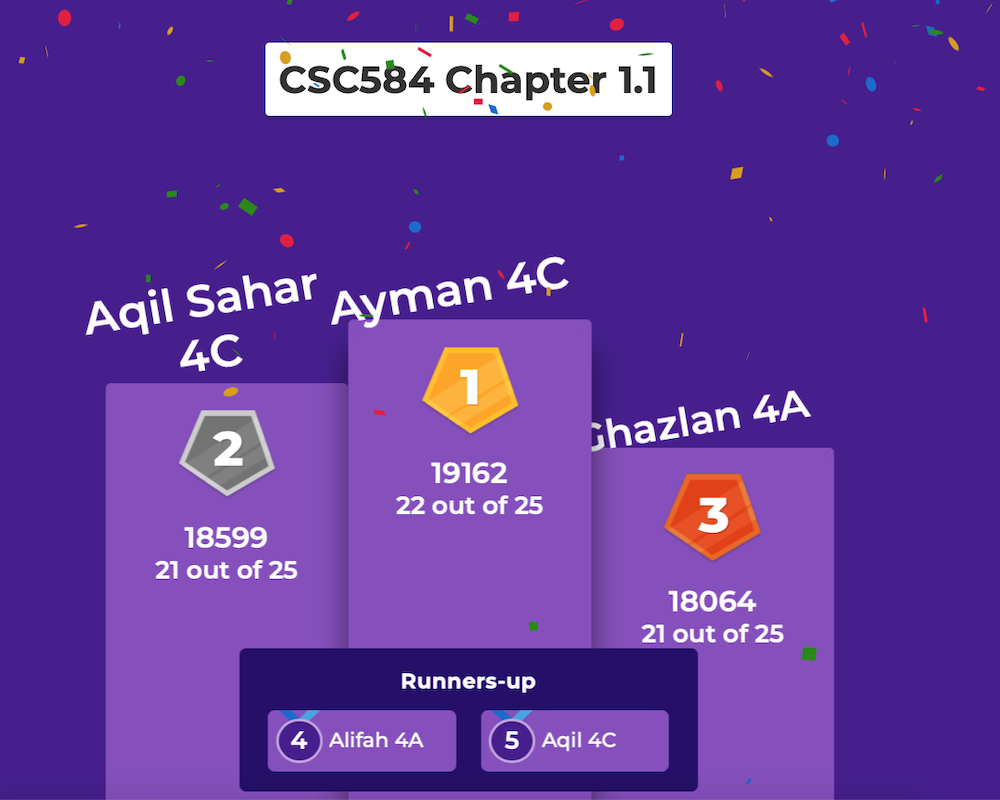
Chapter 1.1 – Review of Object Oriented Programming Concepts
Chapter 1.2 – Review of Object Oriented Programming Concepts (Inheritance)
Chapter 2 – Introduction to Java Enterprise Edition (Java EE)

Chapter 3.1 – Web Component – HTML and Servlet
Chapter 3.2 – Web Component – HTML and Servlet
Chapter 4.1 – Web Component – Java Server Page (JSP)
Chapter 4.2 – Java Server Page (JSP)

Chapter 5 – Java Database connectivity

Chapter 6 – Enterprise JavaBean (EJB) Components
Chapter 7 – Development of Enterprise Application
Chapter 8 – Packaging and Deployment of Enterprise Application
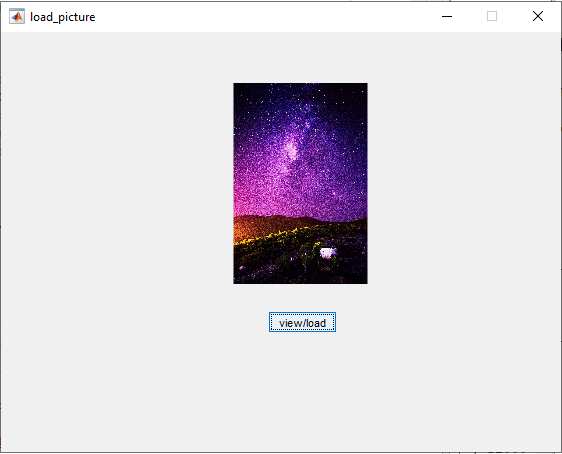
Final GUI for this tutorial:
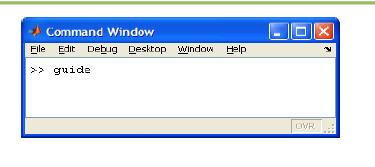
1. Open up MATLAB. Go to the command window and type in guide
2. Choose the first option Blank GUI (Default)
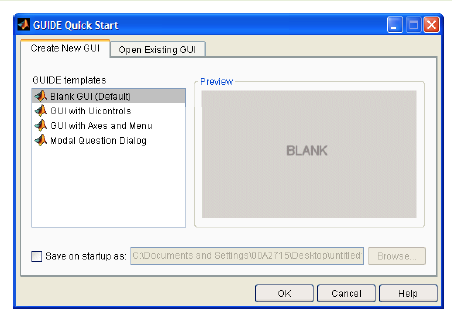
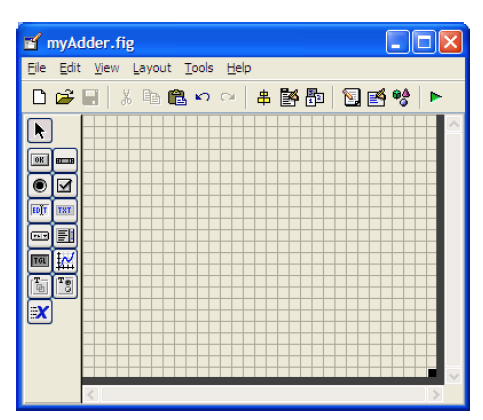
3. You should now see the following screen.
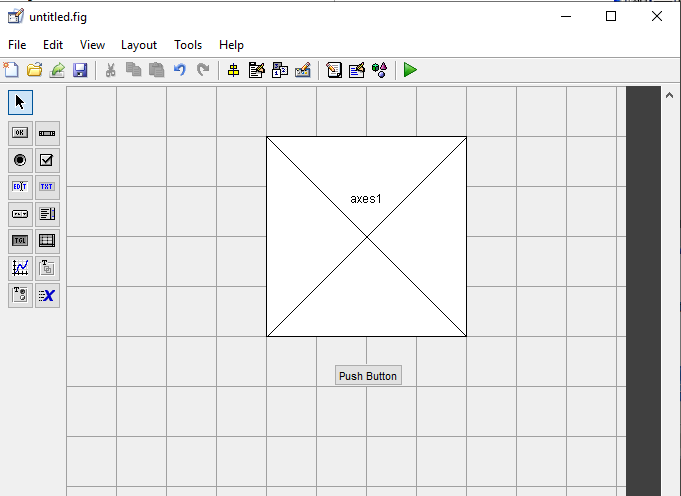
4. Add a Axes and button components to the GUI figure.
The Tag property of Axes is named axes1 and pushbutton1 for button.
Rename the button from Push Button to view/load.
5. Click run and save your GUI wherever you please with your desired filename
6. Add the following code to the function:
function pushbutton1_Callback(hObject, eventdata, handles)
a = imread(‘peppers.png’);
imshow(a);
handles.image0 = a;
guidata(hObject, handles);
7. If you want to load an image from your file explorer, just comment the above code and replace with the following code.
cla(handles.axes1,’reset’);
[filename,pathname]=uigetfile({‘.jpg’; ‘.bmp’},
‘Select an Image’);
a = imread([pathname,filename]);
axes(handles.axes1);
imshow(a);
handles.a = a;
guidata(hObject,handles);
In this Matlab GUI tutorial, you will learn how to create and use the Axes component.
The Axes component allows you to display graphics, such as graphs and images on your GUI.
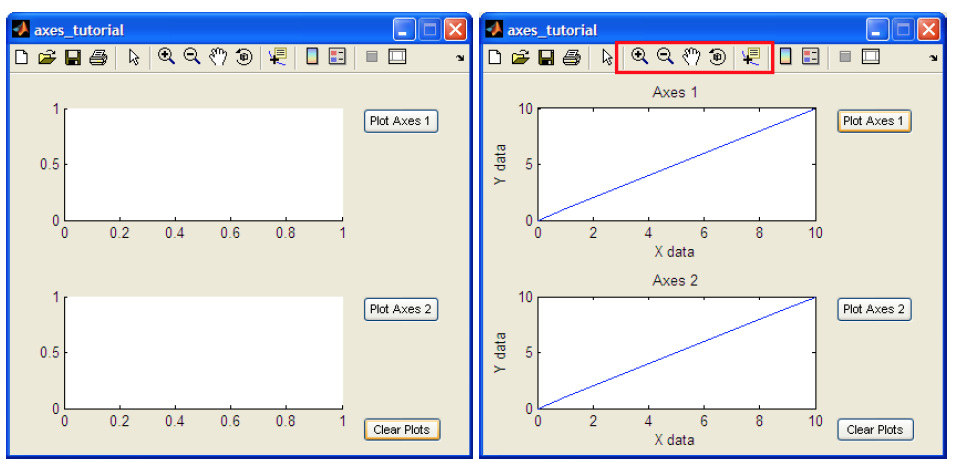
In this tutorial, we will create two axes on the GUI and plot some simple data onto it.
In addition, we will include a reset button to clear the axes and we will also add the standard toolbar to allow the user to zoom, pan, and query the plot.
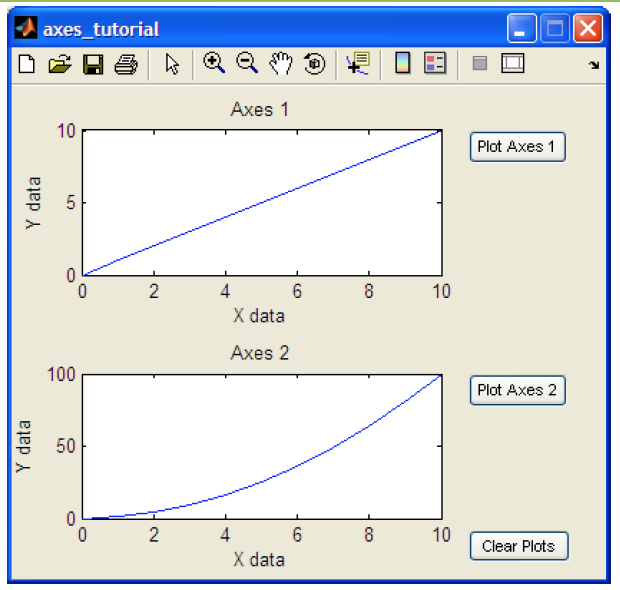
Final GUI for this tutorial:
1. Open up MATLAB. Go to the command window and type in guide
2. Choose the first option Blank GUI (Default)
3. You should now see the following screen.
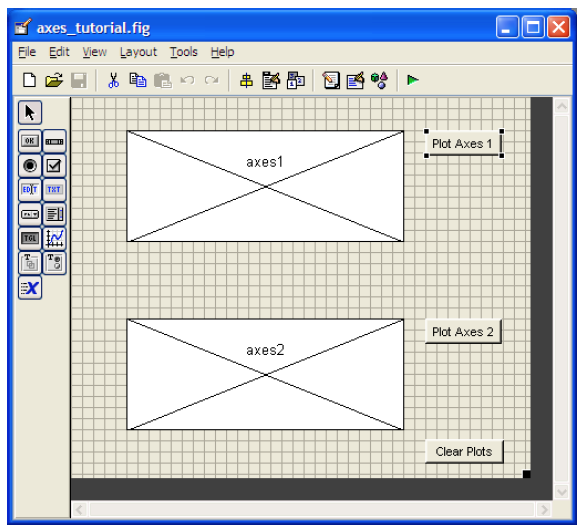
4. For the adder GUI, we will need the following components.
Add two Axes components to the GUI figure.
Add three Pushbutton components onto the GUI figure.
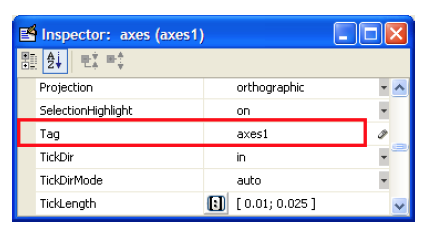
5. Double click the Axes component to bring up the Property Inspector.
The Tag property is named axes1.
The other Axes component’s Tag property is named axes2.
6. Modify the properties of the Pushbutton components.
Double click on one of the Pushbutton components.
Change the String property to Plot Axes 1, and the Tag property to plotAxes1_pushbutton
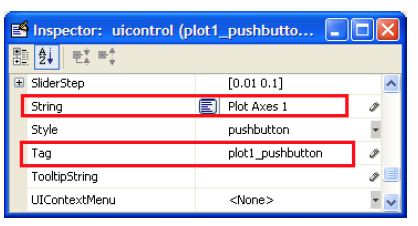
7. Double click on the next pushbutton and change the String property to Plot Axes 2 and change the Tag property to plotAxes2_pushbutton.
Double click on the final pushbutton and change the String property to Clear Axes and change the Tag property to clearAxes_pushbutton.
8. The figure should look like below after you add the components and modify them.
9. Save your GUI wherever you please with your desired filename.
10. Open up the .m file that was automatically generated when you saved your GUI.
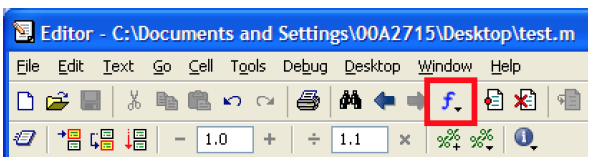
11. In the MATLAB editor, click on the icon (f), which will bring up a list of the functions within the .m file.
Select plot1_pushbutton_Callback.
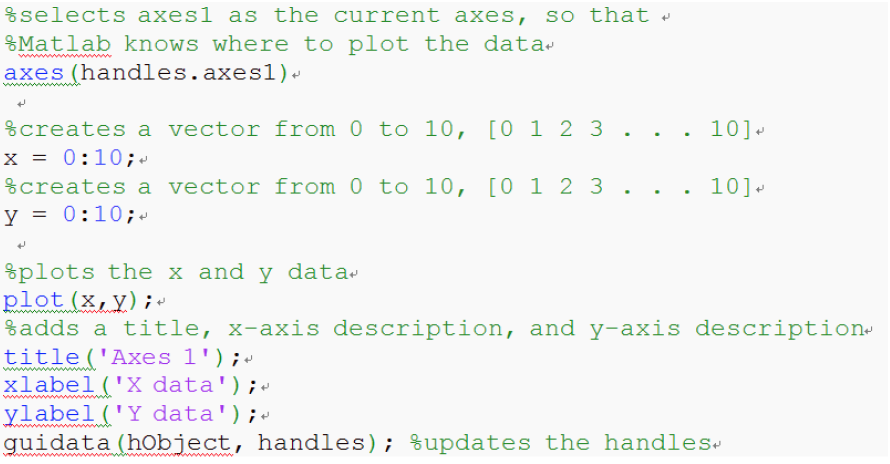
12. Add the following code to the function:
Copy and paste the code
axes(handles.axes1)
x = 0:10;
y = 0:10;
plot(x,y);
title(‘Axes 1’);
xlabel(‘X data’);
ylabel(‘Y data’);
guidata(hObject, handles);
13. Put the following code into the plot2_pushbutton_Callback:
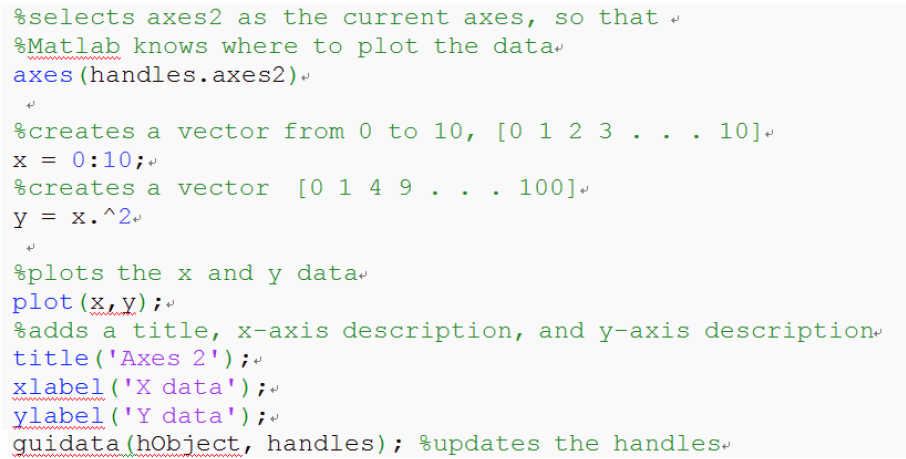
Copy and paste the code
axes(handles.axes2)
x = 0:5;
y = 0:5;
plot(x,y);
title(‘Axes 2’);
xlabel(‘X data’);
ylabel(‘Y data’);
guidata(hObject, handles);
14. Add some code to the clearPlots_pushbutton_Callback:
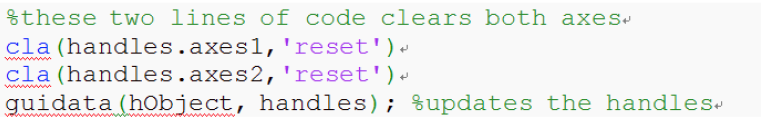
Copy and paste the code
cla(handles.axes1,’reset’)
cla(handles.axes2,’reset’)
guidata(hObject, handles);
Add the following line of code to axes_tutorial_OpeningFcn:
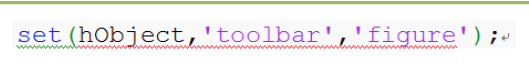
Copy and paste the code
set(hObject, ‘toolbar’,’figure’);
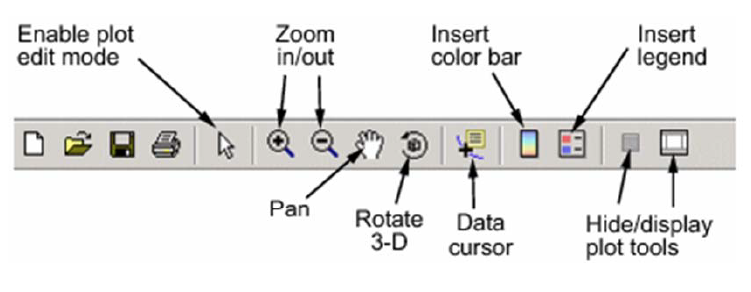
This line of code effectively adds the standard toolbar to the GUI, allowing the user to zoom, pan, query the plot, and more.
15. From the GUIDE editor, you can click BUTTON PLAY on the to launch the GUI.
END