Recognise flowers using CNN in MATLAB with GUI
- Download the flower dataset.
- Put in the same path with the digit dataset.
- Open MATLAB go to the desktop directories.
- Click ANN.m file to open.
- Adjust the flower dataset file path based on your flower dataset location.
- Adjust the parameters to meet with the new dataset.
- imageInputLayer([28 28 1]) change to imageInputLayer([50 50 3])
- comment numTrainFiles = 200; to %numTrainFiles = 200;
- numTrainFiles = 4800 * (PercentageTrainFile / 100); change to numTrainFiles = 20 * (PercentageTrainFile / 100);
- fullyConnectedLayer(8) change to fullyConnectedLayer(4)
- Once done click run.
That’s all 🙂
Develop a CNN project with GUI in Matlab
- Download the project file above.
- Put in the desktop.
- Open MATLAB go to the desktop directories.
- Click ANN.m file to open.
- Adjust the dataset file path based on your dataset location. (E.g “C:\Users\Izzad\Desktop\ANN GUI”)
- Once done click run.
That’s all for this part 🙂
CNN using MATLAB Toolbox
- Search simple deep learning in the search field.
- Find “Create Simple Deep Learning Network for Classification”.
- Click open live script.
- Run the example.
- See the accuracy rate
- Adjust the parameters.
- Compare the accuracy result.
That’s all for this part:)
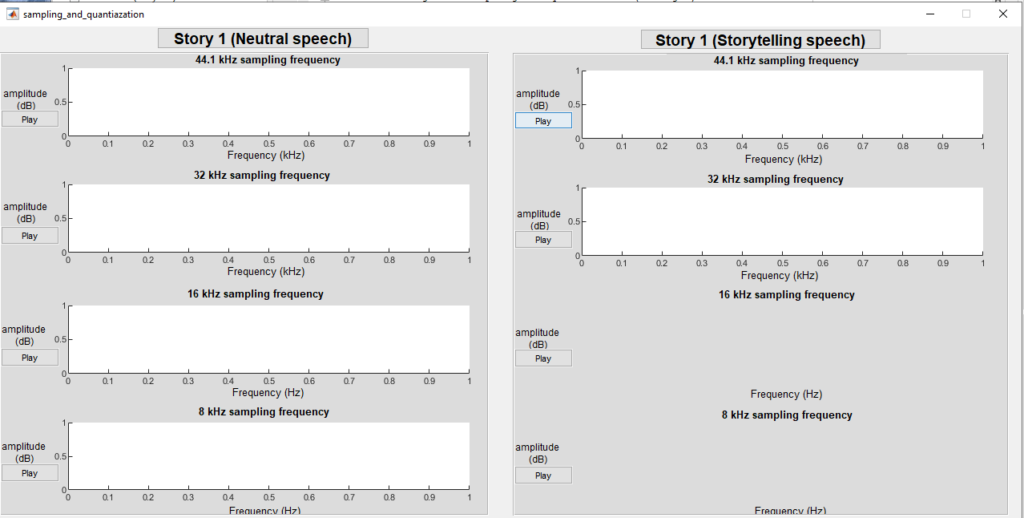
CNN toolbox with MATLAB GUI

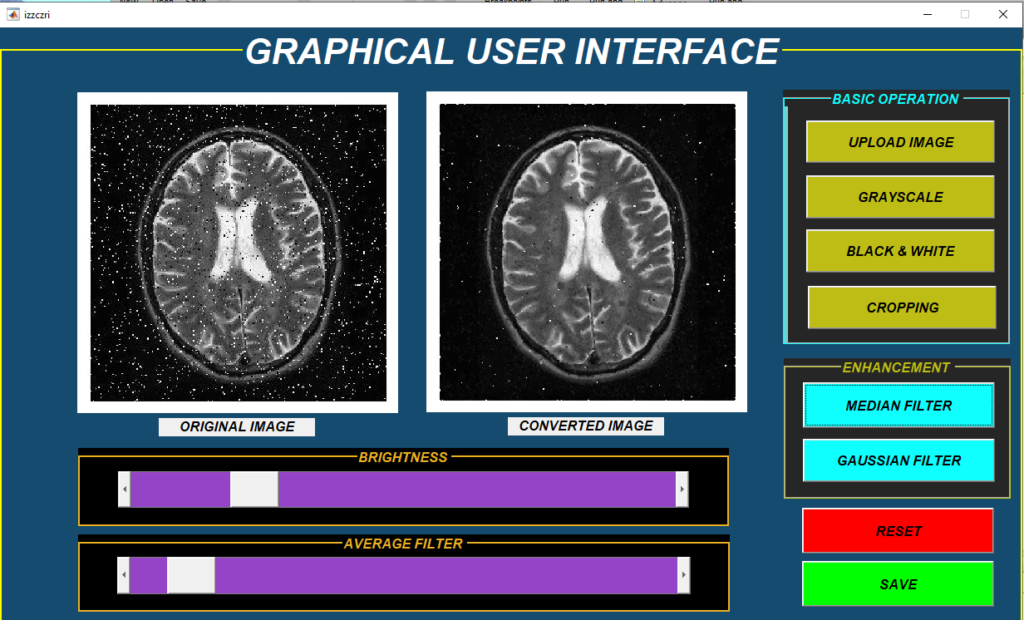
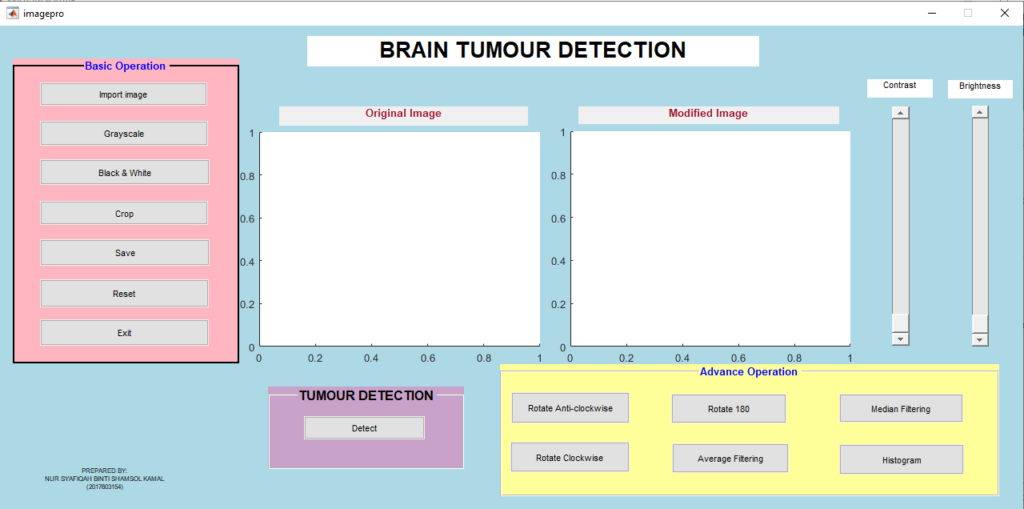
Example of MATLAB GUI projects
Example 1
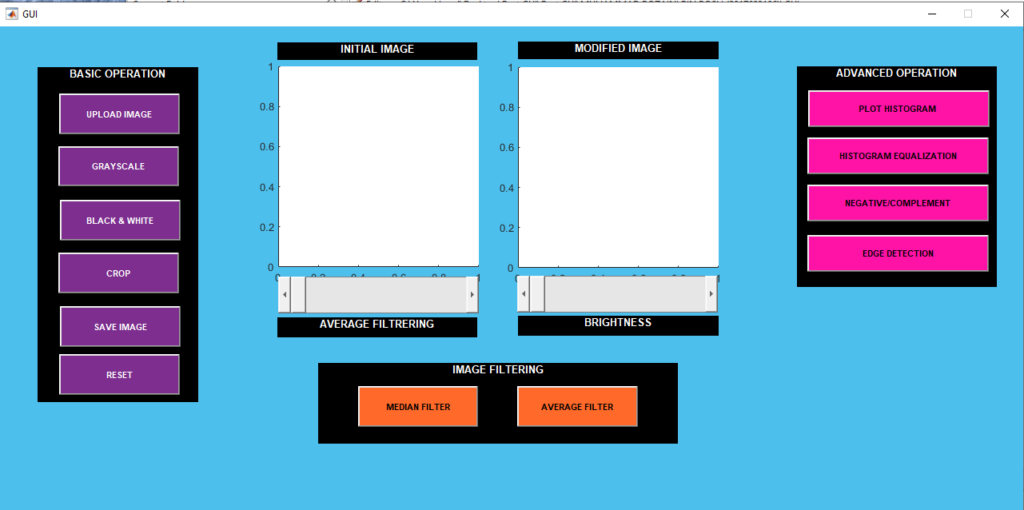
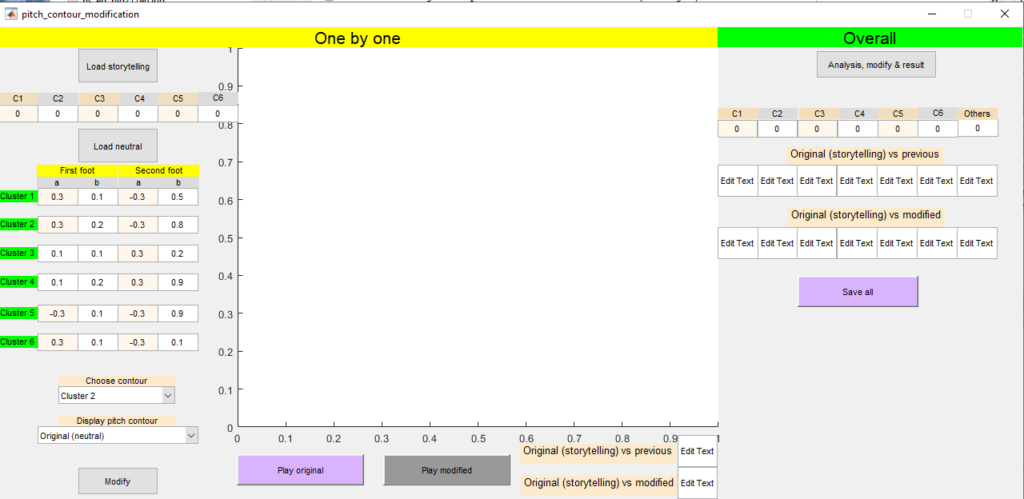
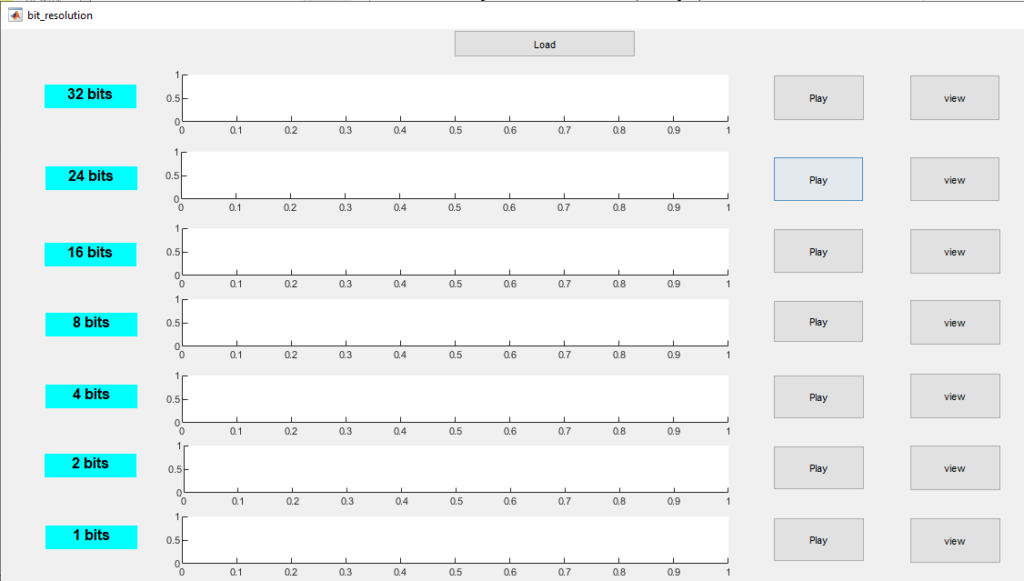
Example 2
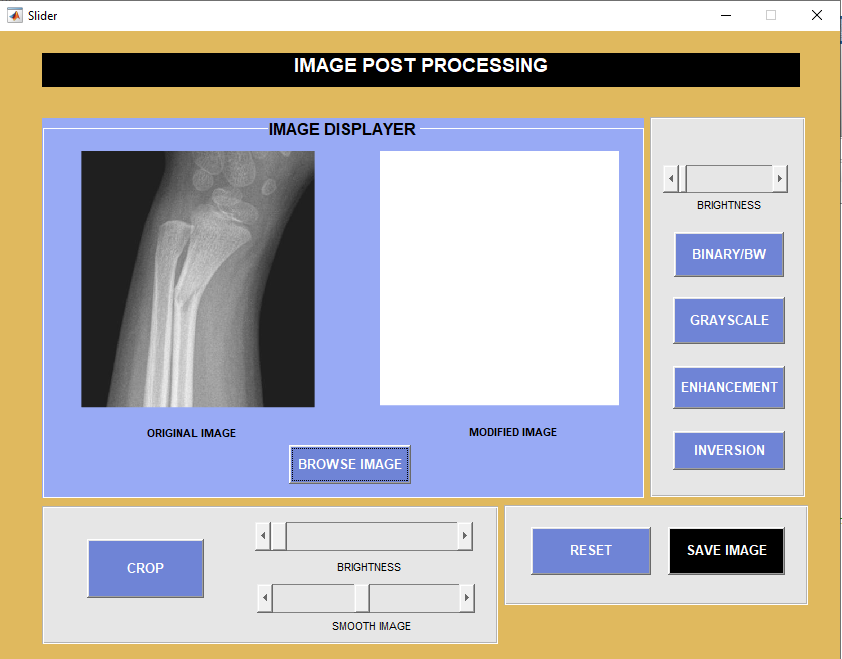
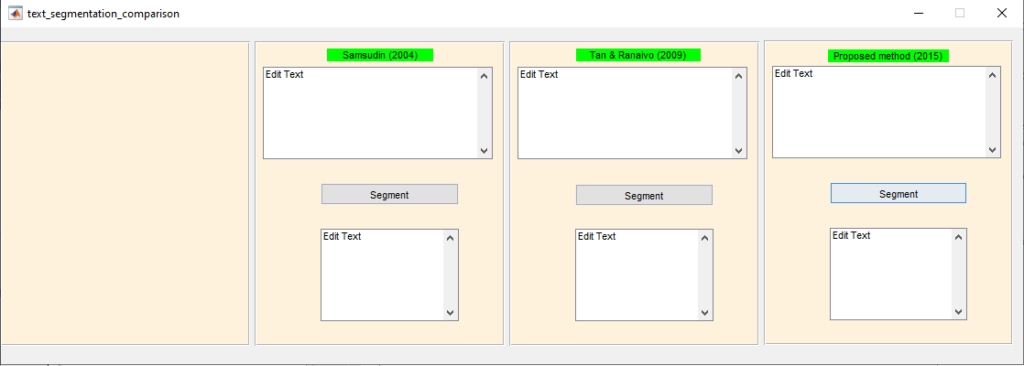
Example 3
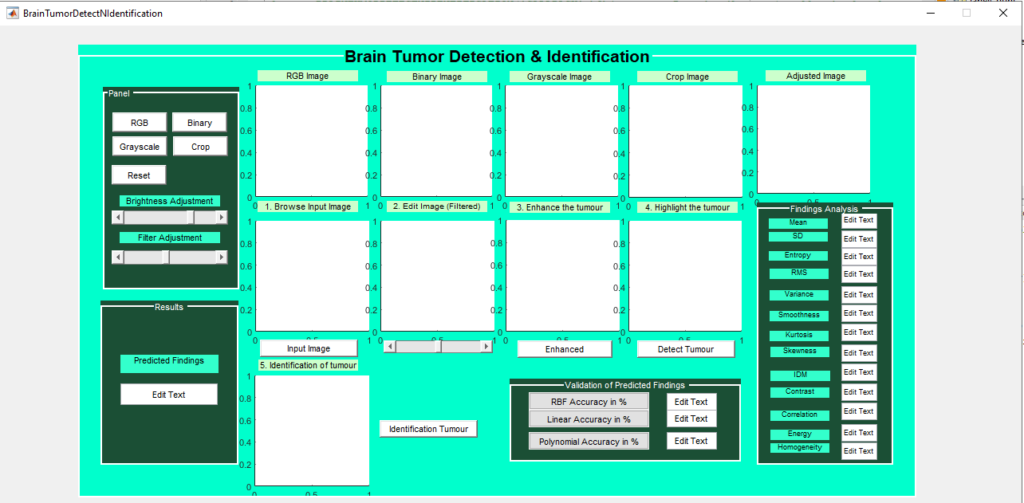
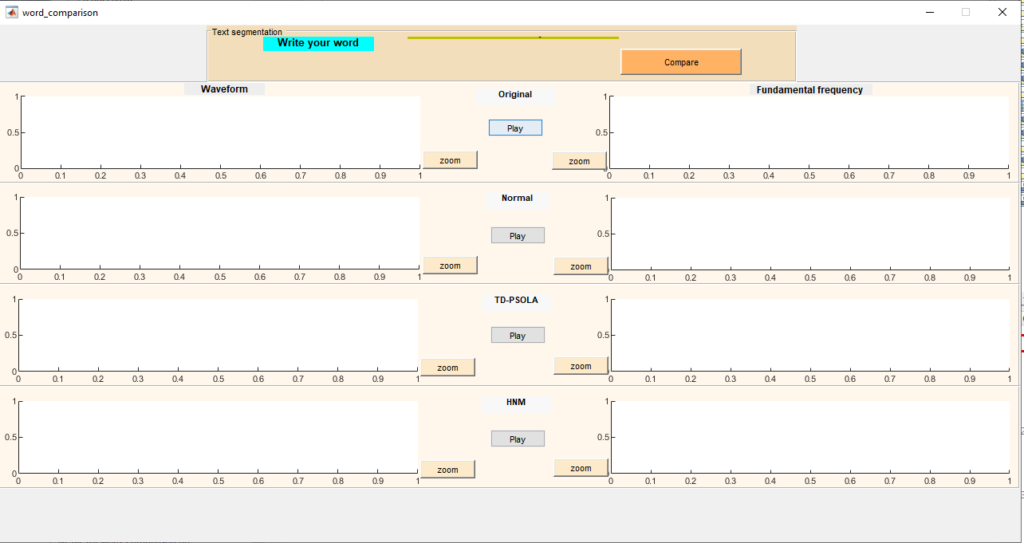
Example 4
Example 5
Note: To produce standalone program run this code mcc -m filename.m
Others
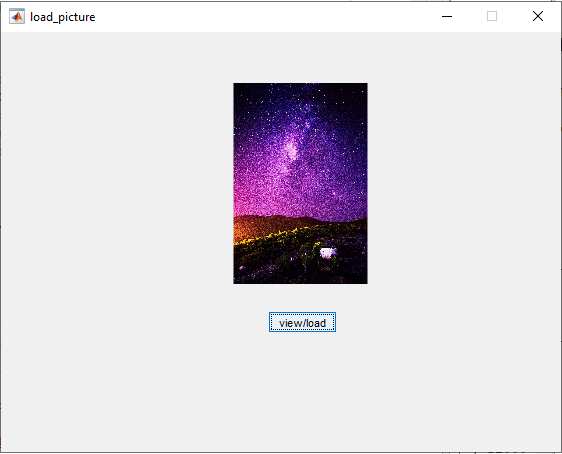
Basic GUI (Insert image to Axes)
Final GUI for this tutorial:
Initializing GUIDE (GUI Creator)
1. Open up MATLAB. Go to the command window and type in guide
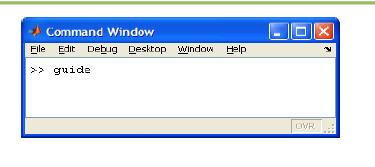
2. Choose the first option Blank GUI (Default)
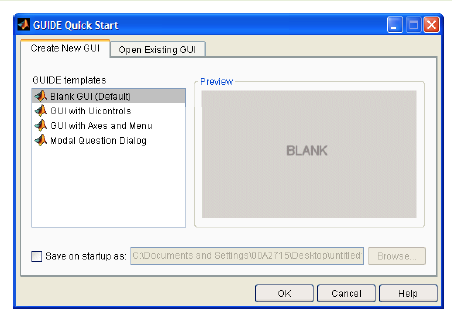
3. You should now see the following screen.
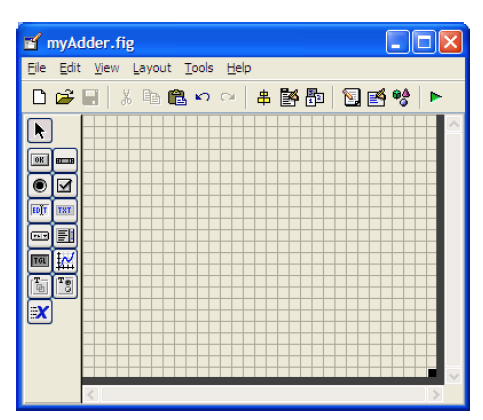
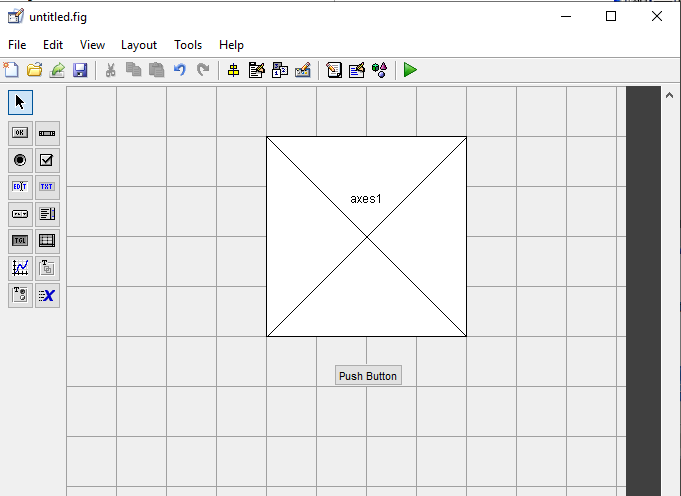
4. Add a Axes and button components to the GUI figure.
The Tag property of Axes is named axes1 and pushbutton1 for button.
Rename the button from Push Button to view/load.
5. Click run and save your GUI wherever you please with your desired filename
Writing the Code for the GUI Callbacks
6. Add the following code to the function:
function pushbutton1_Callback(hObject, eventdata, handles)
a = imread(‘peppers.png’);
imshow(a);
handles.image0 = a;
guidata(hObject, handles);
7. If you want to load an image from your file explorer, just comment the above code and replace with the following code.
cla(handles.axes1,’reset’);
[filename,pathname]=uigetfile({‘.jpg’; ‘.bmp’},
‘Select an Image’);
a = imread([pathname,filename]);
axes(handles.axes1);
imshow(a);
handles.a = a;
guidata(hObject,handles);
Basic GUI (Plotting data to Axes)
In this Matlab GUI tutorial, you will learn how to create and use the Axes component.
The Axes component allows you to display graphics, such as graphs and images on your GUI.
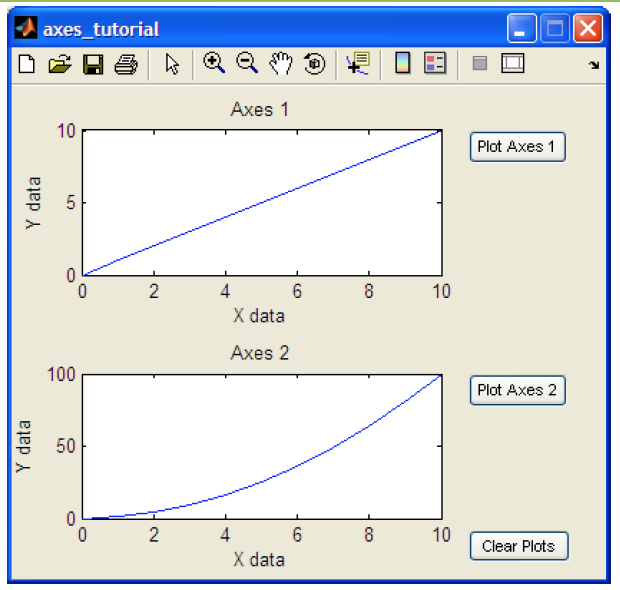
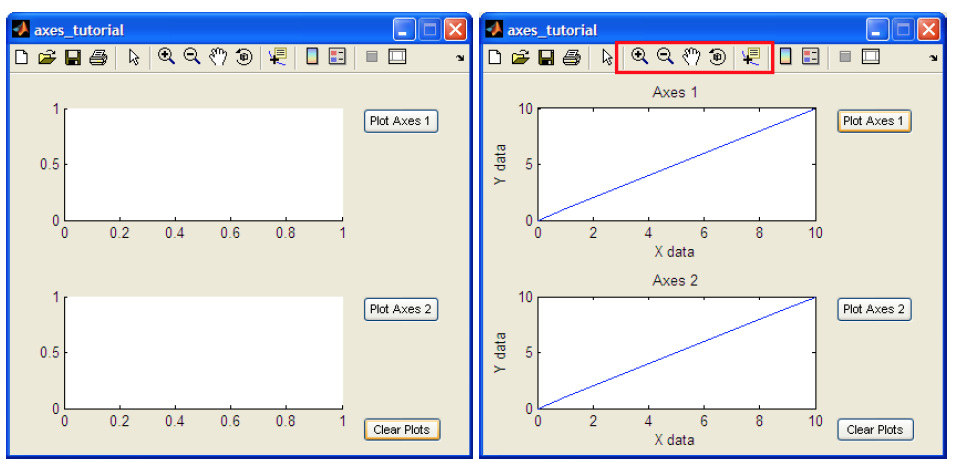
In this tutorial, we will create two axes on the GUI and plot some simple data onto it.
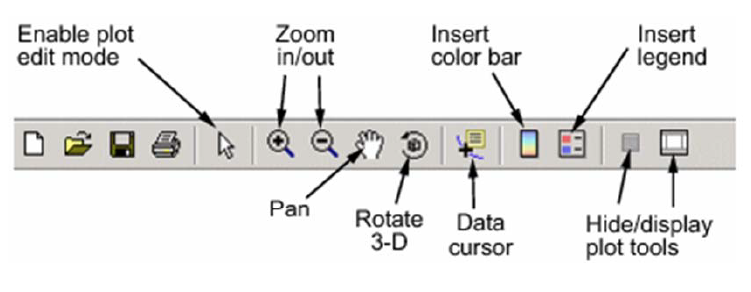
In addition, we will include a reset button to clear the axes and we will also add the standard toolbar to allow the user to zoom, pan, and query the plot.
Final GUI for this tutorial:
Initializing GUIDE (GUI Creator)
1. Open up MATLAB. Go to the command window and type in guide
2. Choose the first option Blank GUI (Default)
3. You should now see the following screen.
4. For the adder GUI, we will need the following components.
Add two Axes components to the GUI figure.
Add three Pushbutton components onto the GUI figure.
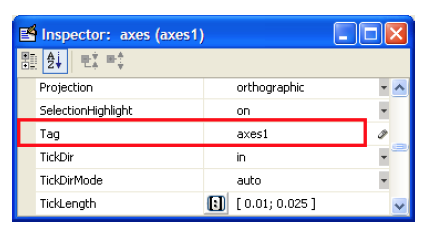
5. Double click the Axes component to bring up the Property Inspector.
The Tag property is named axes1.
The other Axes component’s Tag property is named axes2.
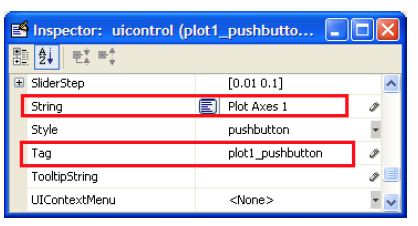
6. Modify the properties of the Pushbutton components.
Double click on one of the Pushbutton components.
Change the String property to Plot Axes 1, and the Tag property to plotAxes1_pushbutton
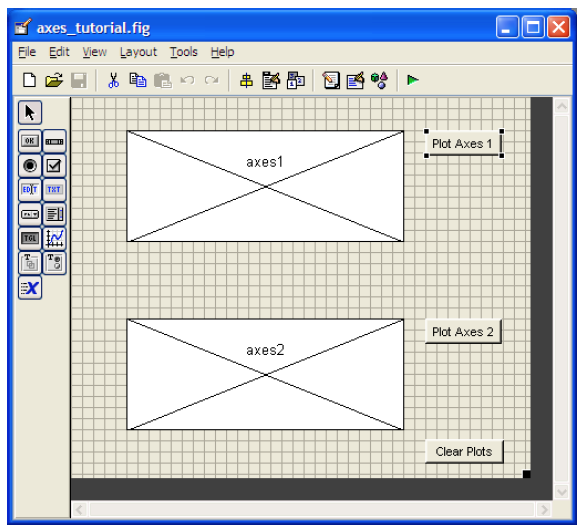
7. Double click on the next pushbutton and change the String property to Plot Axes 2 and change the Tag property to plotAxes2_pushbutton.
Double click on the final pushbutton and change the String property to Clear Axes and change the Tag property to clearAxes_pushbutton.
8. The figure should look like below after you add the components and modify them.
9. Save your GUI wherever you please with your desired filename.
Writing the Code for the GUI Callbacks
10. Open up the .m file that was automatically generated when you saved your GUI.
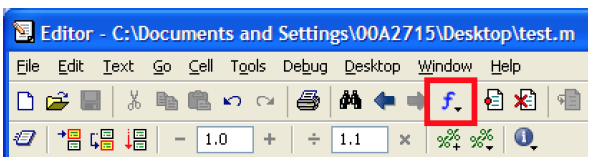
11. In the MATLAB editor, click on the icon (f), which will bring up a list of the functions within the .m file.
Select plot1_pushbutton_Callback.
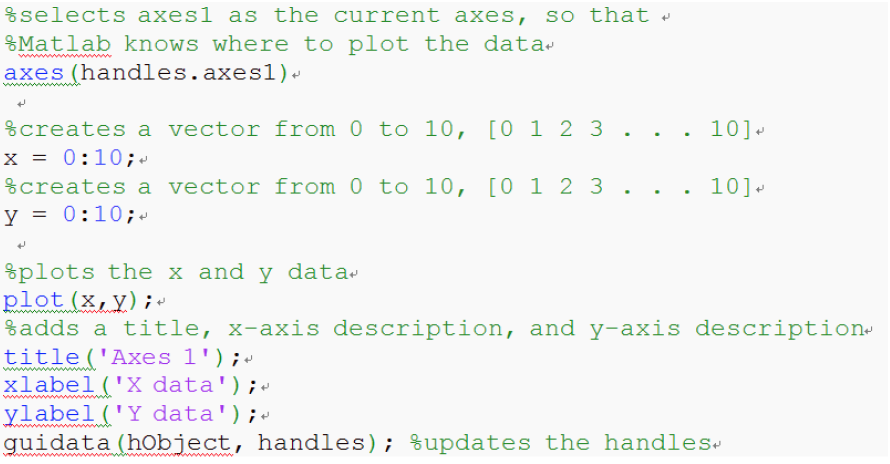
12. Add the following code to the function:
Copy and paste the code
axes(handles.axes1)
x = 0:10;
y = 0:10;
plot(x,y);
title(‘Axes 1’);
xlabel(‘X data’);
ylabel(‘Y data’);
guidata(hObject, handles);
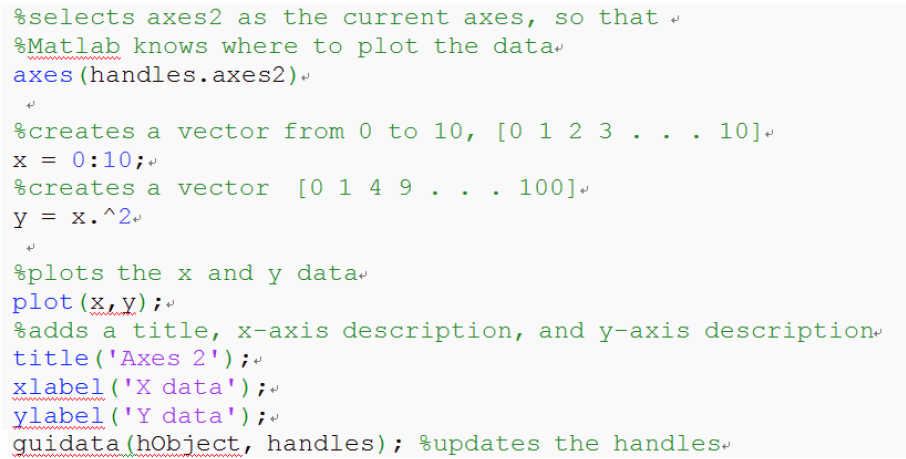
13. Put the following code into the plot2_pushbutton_Callback:
Copy and paste the code
axes(handles.axes2)
x = 0:5;
y = 0:5;
plot(x,y);
title(‘Axes 2’);
xlabel(‘X data’);
ylabel(‘Y data’);
guidata(hObject, handles);
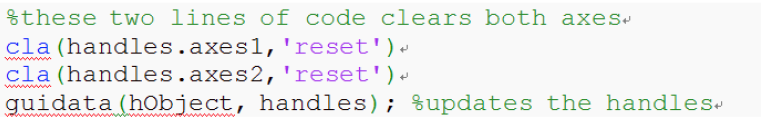
14. Add some code to the clearPlots_pushbutton_Callback:
Copy and paste the code
cla(handles.axes1,’reset’)
cla(handles.axes2,’reset’)
guidata(hObject, handles);
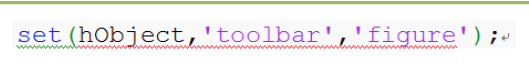
Add the following line of code to axes_tutorial_OpeningFcn:
Copy and paste the code
set(hObject, ‘toolbar’,’figure’);
This line of code effectively adds the standard toolbar to the GUI, allowing the user to zoom, pan, query the plot, and more.
15. From the GUIDE editor, you can click BUTTON PLAY on the to launch the GUI.
END
Basic GUI (Pop-up menu)
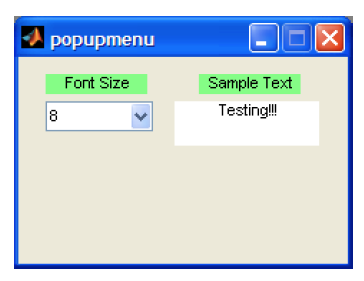
Final GUI for this tutorial

Initializing GUIDE (GUI Creator)
1. Open up MATLAB. Go to the command window and type in guide
2. Choose the first option Blank GUI (Default)
3. You should now see the following screen.
4. For the adder GUI, we will need the following components
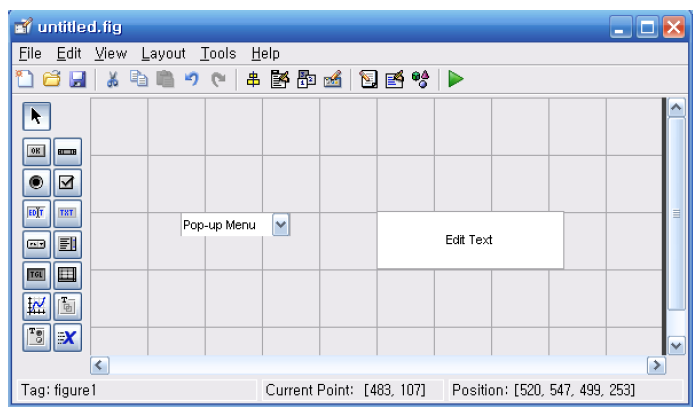
Add an Edit Text component to the GUI figure.
Add a Pop-up Menu component onto the GUI figure.
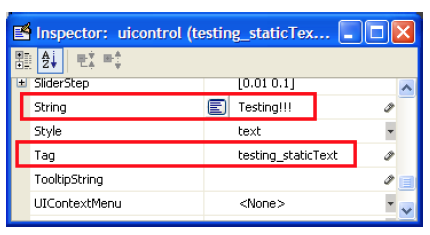
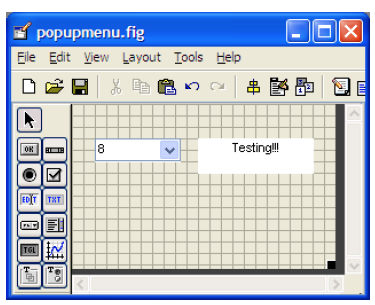
5. Double click the Edit Text component to bring up the Property Inspector.
Change the String property to Testing!!!, and change the Tag property to testing_staticText as shown in the figure below:
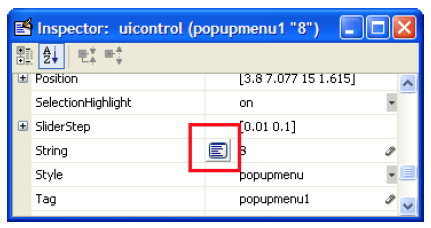
6. Modify the properties of the Pop-up Menu component.
Click on the icon on the String property line as shown below.
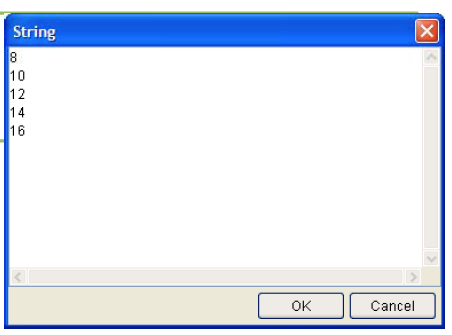
7. After clicking on the icon, you should now see the following window.
Fill in the window as shown below:
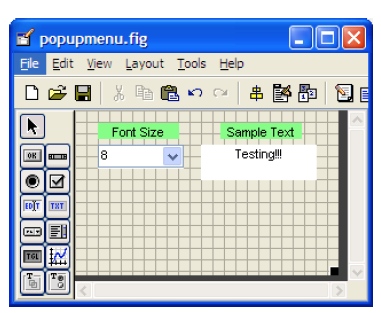
5. The figure should look like after you add the components and modify them.
6. Add some Static Text components to add some description tags to the GUI.
Modify their text by double clicking on the component and changing the String property.
7. Save your GUI wherever you please with your desired filename.
Writing the Code for the GUI Callbacks
8. Open up the .m file that was automatically generated when you saved your GUI.
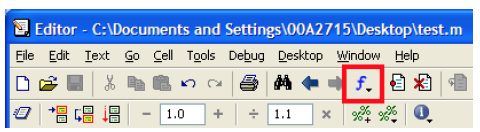
9. In the MATLAB editor, click on the icon (f), which will bring up a list of the functions within the .m file.
Select popupmenu1_Callback.
10. Add the following code to the function:
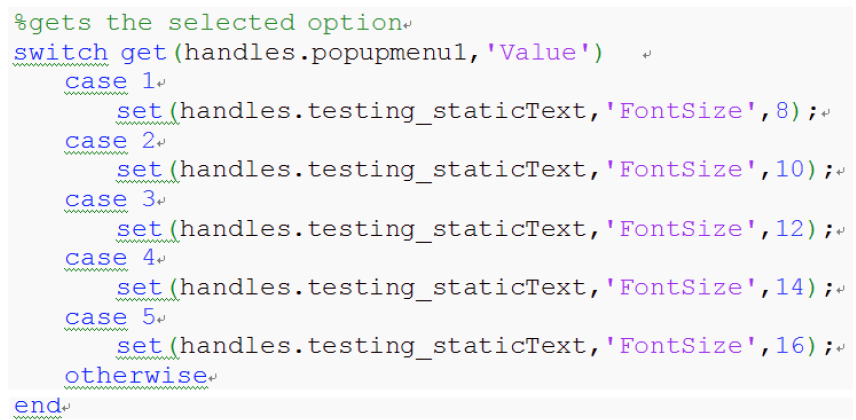
Copy and paste the code
switch get (handles.popupmenu1, ‘Value’)
case 1
set(handles.testing_staticText,’FontSize’,8);
case 2
set(handles.testing_staticText,’FontSize’,10);
case 3
set(handles.testing_staticText,’FontSize’,12);
case 4
set(handles.testing_staticText,’FontSize’,14);
case 5
set(handles.testing_staticText,’FontSize’,16);
otherwise
end
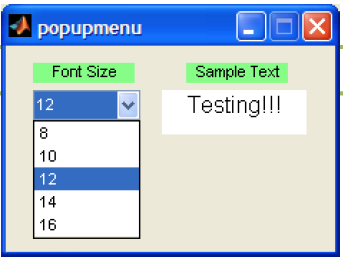
11) You can click BUTTON PLAY on the to launch the GUI.
Go ahead and try selecting different font sizes.
END
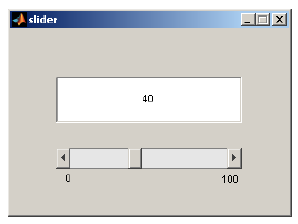
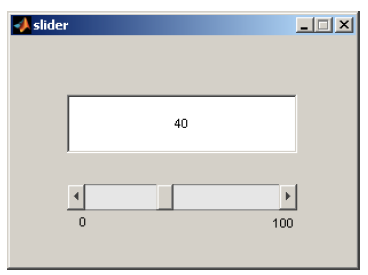
Basic GUI (Slider)
Final GUI for this tutorial
Initializing GUIDE (GUI Creator)
1. Open up MATLAB. Go to the command window and type in guide
2. Choose the first option Blank GUI (Default)
3. You should now see the following screen.
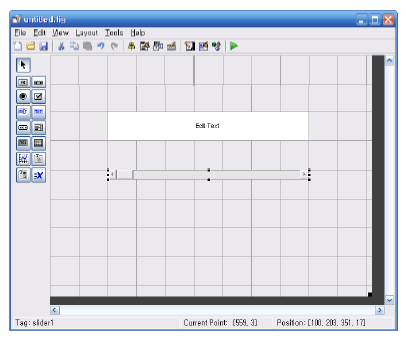
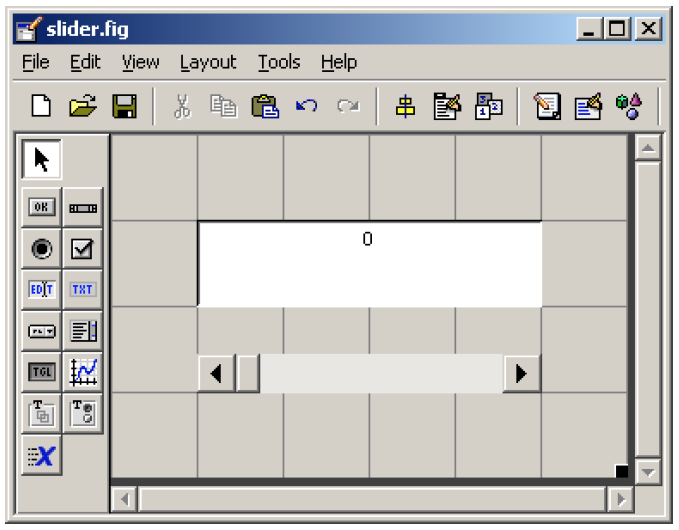
4. For the adder GUI, we will need the following components
Add an Edit Text component to the GUI figure.
Add a Slider component onto the GUI figure.
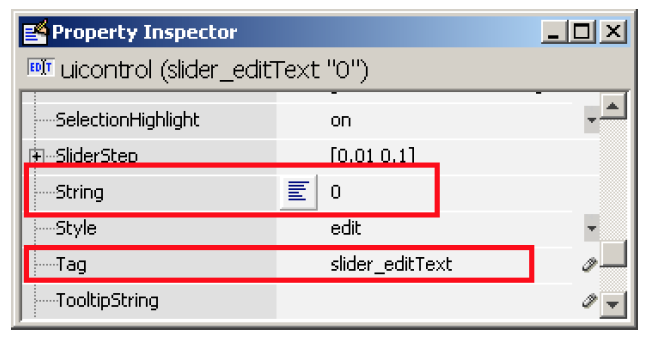
5. Edit the properties of these components.
Double click the Edit Text component to bring up the Property Inspector.
Change the String property to 0, and change the Tag property to slider_editText.
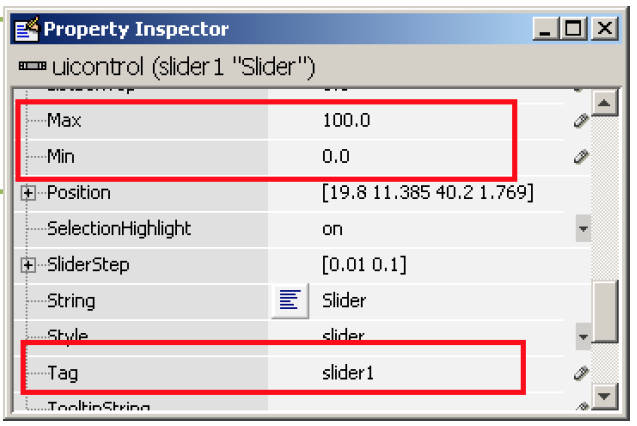
6. Modify the properties of the Slider component.
Sit the Min property to 0, and the Max property to 100.
Change the Tag property to slider1.
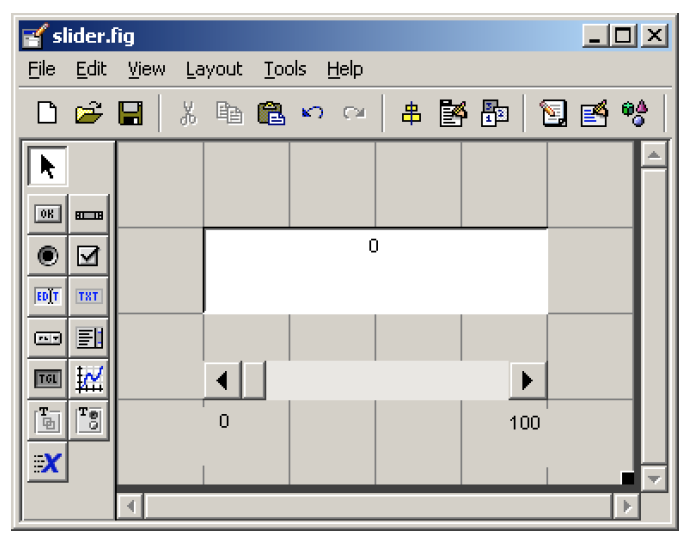
7. The figure should look like after you add the components and modify them.
8. Add some Static Text components to specify the min and max values of the slider.
Modify their text by double clicking on the component and changing the String property.
It’s not required, but I highly recommend it.
9. Save your GUI wherever you please with your desired filename.
Writing the Code for the GUI Callbacks
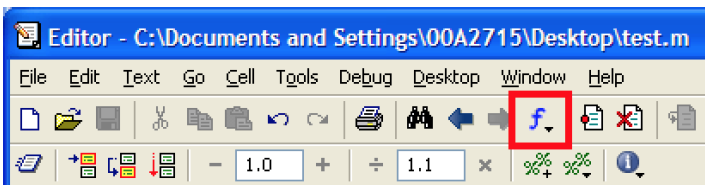
10. Open up the .m file that was automatically generated when you saved your GUI.
11. In the MATLAB editor, click on the icon, which will bring up a list of the functions within the .m file.
Select slider1_Callback.
12. Add the following code to the function:
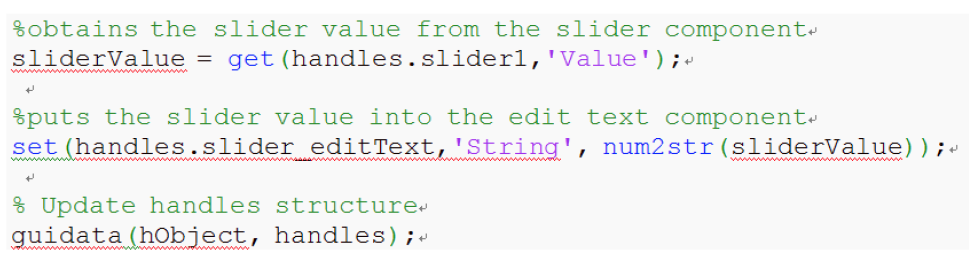
Copy and paste the code
sliderValue = get(handles.slider1, ‘Value’);
set(handles.slider_editText, ‘String’, num2str(sliderValue));
guidata(hObject, handles);
13. Add the following code to the slider_editText_Callback function:
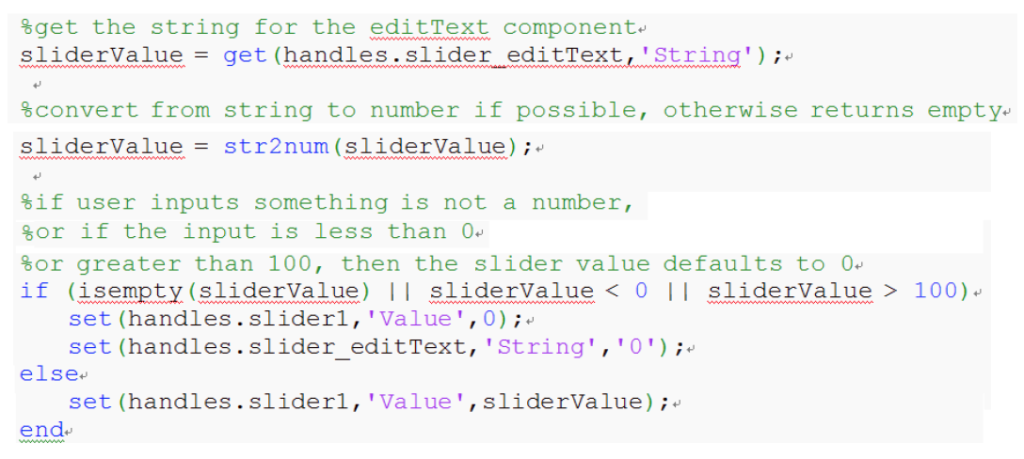
Copy and paste the code
sliderValue = get(handles.slider_editText, ’String’);
sliderValue = strnum(sliderValue);
if (isempty(sliderValue) || sliderValue < 0 || sliderValue > 100)
set (handles.slider1, ‘Value’,0);
set (handles.slider_editText, ‘String’,’0’);
else
set (handles.slider1,’Value’,sliderValue);
end
14. From the GUIDE editor, you can click BUTTON PLAY on the to launch the GUI.
15. Now, try to put in different types of inputs to test the GUI. Any input that is not a number, less than zero, or greater than 100 should default the slider to a value of zero.
END