Archive September 14, 2021

Basic GUI (Plotting data to Axes)

In this Matlab GUI tutorial, you will learn how to create and use the Axes component.

The Axes component allows you to display graphics, such as graphs and images on your GUI.

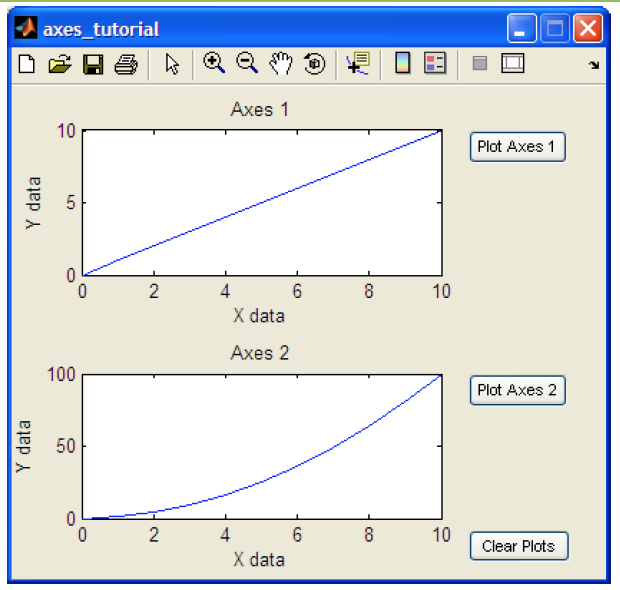
In this tutorial, we will create two axes on the GUI and plot some simple data onto it.

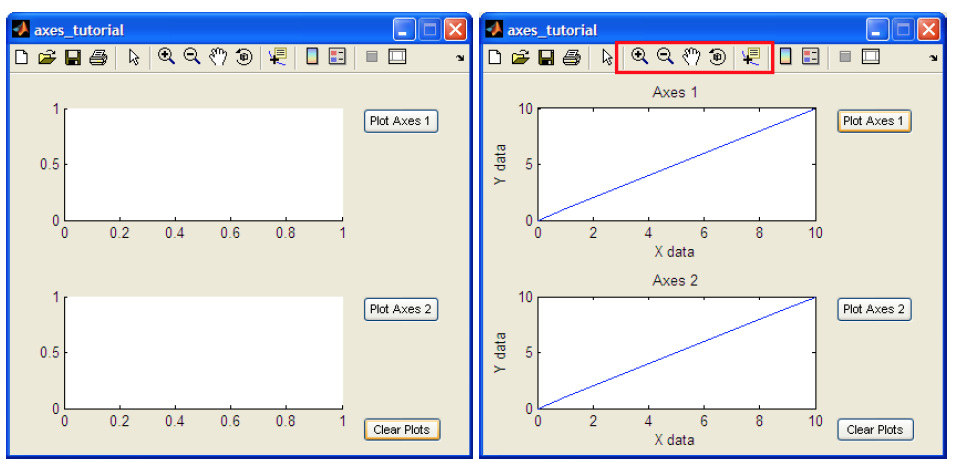
In addition, we will include a reset button to clear the axes and we will also add the standard toolbar to allow the user to zoom, pan, and query the plot.

Final GUI for this tutorial:
Initializing GUIDE (GUI Creator)

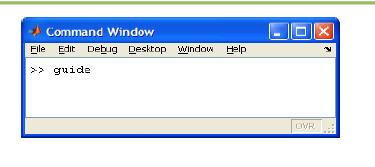
1. Open up MATLAB. Go to the command window and type in guide
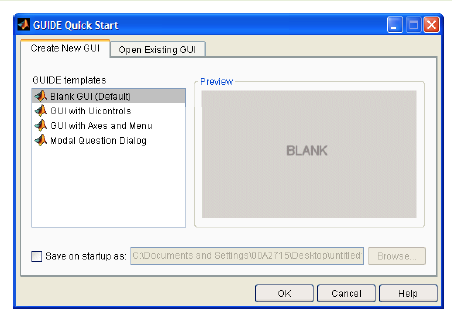
2. Choose the first option Blank GUI (Default)
3. You should now see the following screen.
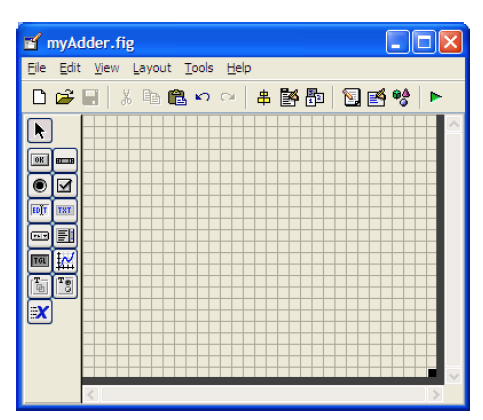
4. For the adder GUI, we will need the following components.

Add two Axes components to the GUI figure.

Add three Pushbutton components onto the GUI figure.

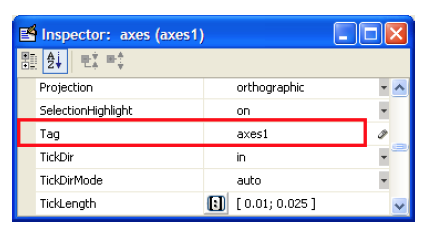
5. Double click the Axes component to bring up the Property Inspector.

The Tag property is named axes1.

The other Axes component’s Tag property is named axes2.
6. Modify the properties of the Pushbutton components.

Double click on one of the Pushbutton components.

Change the String property to Plot Axes 1, and the Tag property to plotAxes1_pushbutton
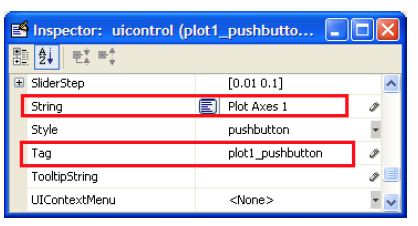
7. Double click on the next pushbutton and change the String property to Plot Axes 2 and change the Tag property to plotAxes2_pushbutton.

Double click on the final pushbutton and change the String property to Clear Axes and change the Tag property to clearAxes_pushbutton.

8. The figure should look like below after you add the components and modify them.
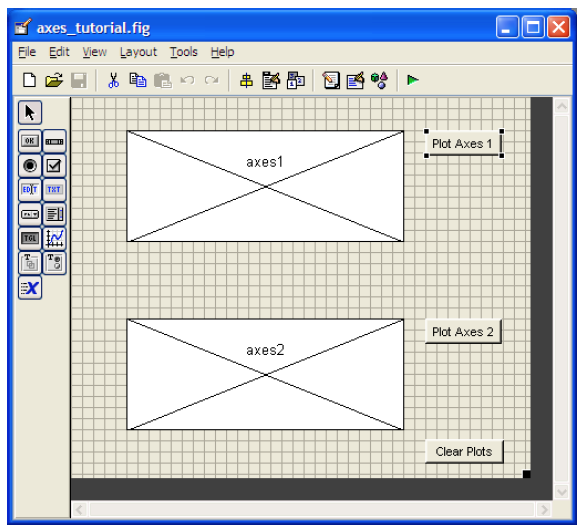
9. Save your GUI wherever you please with your desired filename.


Writing the Code for the GUI Callbacks

10. Open up the .m file that was automatically generated when you saved your GUI.

11. In the MATLAB editor, click on the icon (f), which will bring up a list of the functions within the .m file.

Select plot1_pushbutton_Callback.

12. Add the following code to the function:
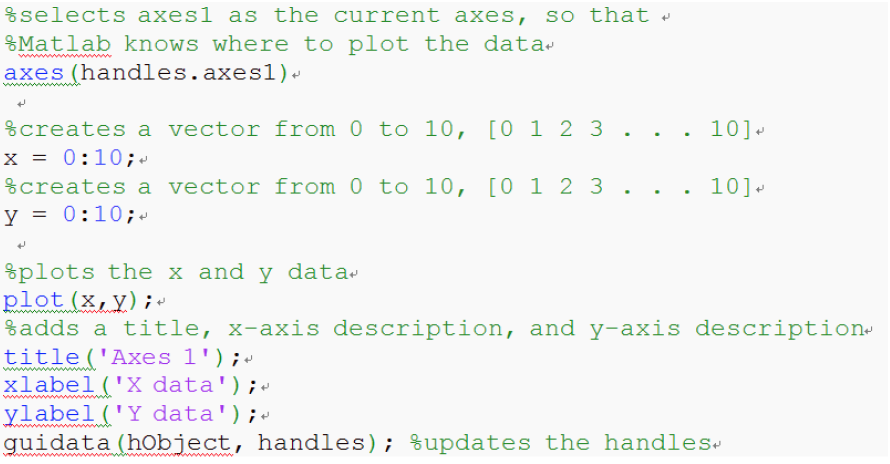
Copy and paste the code

axes(handles.axes1)
x = 0:10;
y = 0:10;
plot(x,y);
title(‘Axes 1’);
xlabel(‘X data’);
ylabel(‘Y data’);
guidata(hObject, handles);

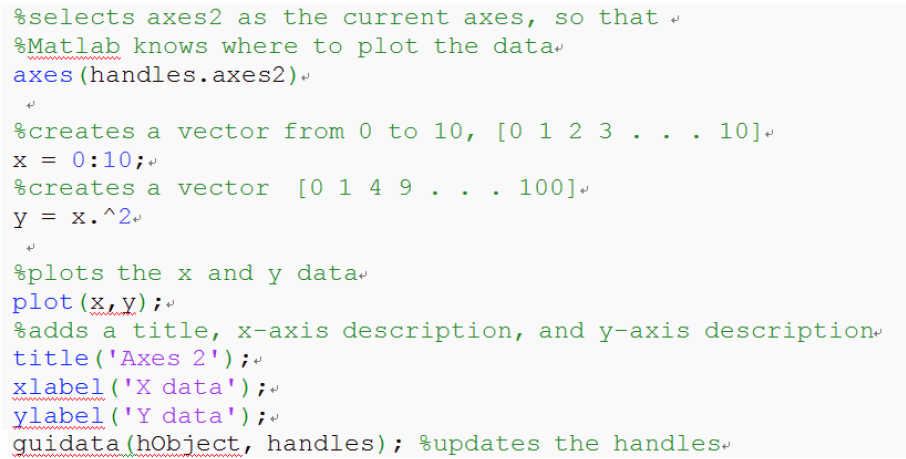
13. Put the following code into the plot2_pushbutton_Callback:
Copy and paste the code

axes(handles.axes2)
x = 0:5;
y = 0:5;
plot(x,y);
title(‘Axes 2’);
xlabel(‘X data’);
ylabel(‘Y data’);
guidata(hObject, handles);

14. Add some code to the clearPlots_pushbutton_Callback:

Copy and paste the code

cla(handles.axes1,’reset’)
cla(handles.axes2,’reset’)
guidata(hObject, handles);

Add the following line of code to axes_tutorial_OpeningFcn:

Copy and paste the code

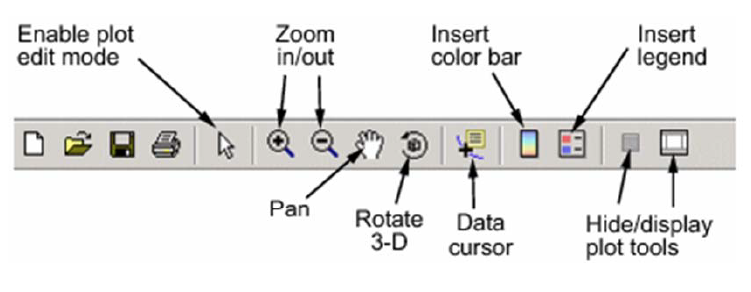
set(hObject, ‘toolbar’,’figure’);

This line of code effectively adds the standard toolbar to the GUI, allowing the user to zoom, pan, query the plot, and more.
15. From the GUIDE editor, you can click BUTTON PLAY on the to launch the GUI.
END
Basic GUI (Pop-up menu)

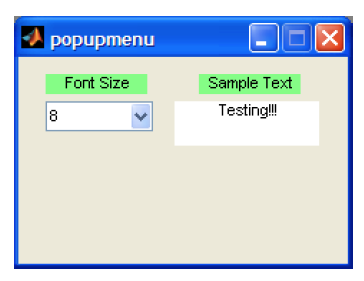
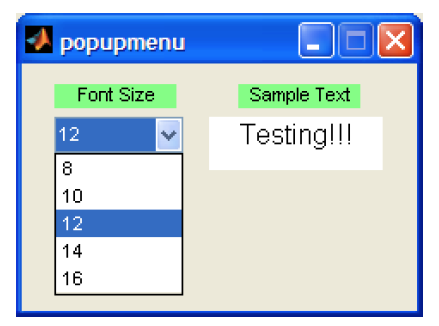
Final GUI for this tutorial

Initializing GUIDE (GUI Creator)

1. Open up MATLAB. Go to the command window and type in guide

2. Choose the first option Blank GUI (Default)

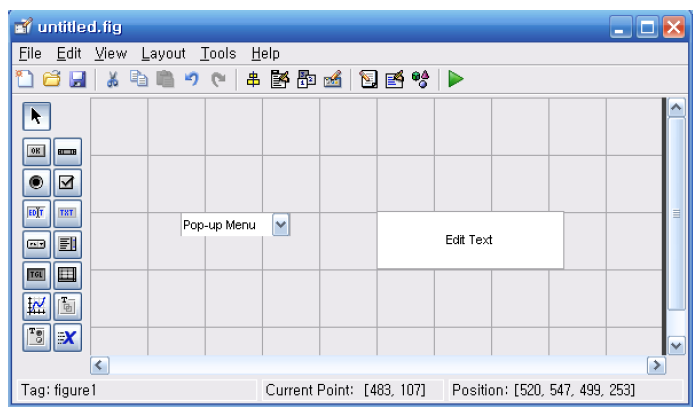
3. You should now see the following screen.

4. For the adder GUI, we will need the following components

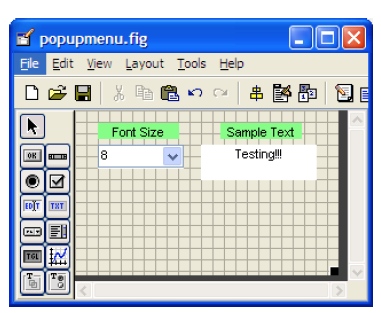
Add an Edit Text component to the GUI figure.

Add a Pop-up Menu component onto the GUI figure.

5. Double click the Edit Text component to bring up the Property Inspector.

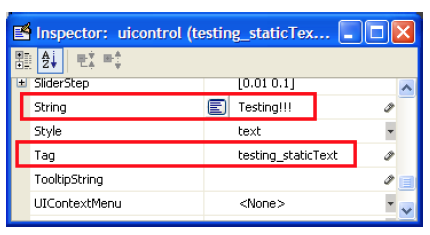
Change the String property to Testing!!!, and change the Tag property to testing_staticText as shown in the figure below:

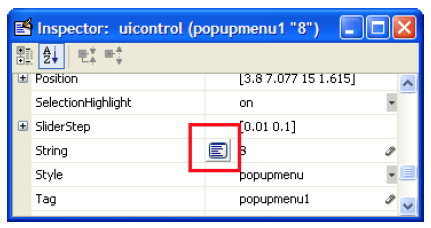
6. Modify the properties of the Pop-up Menu component.

Click on the icon on the String property line as shown below.

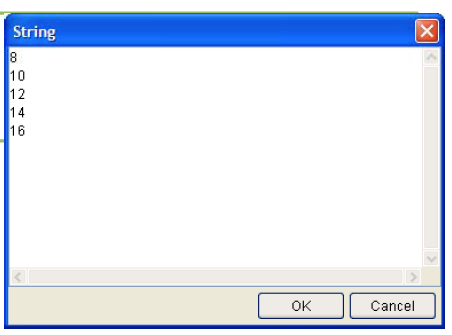
7. After clicking on the icon, you should now see the following window.

Fill in the window as shown below:

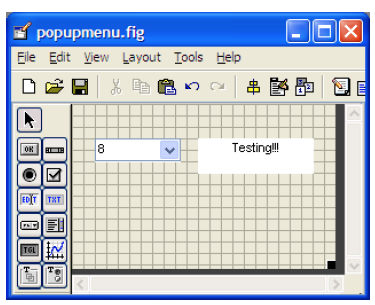
5. The figure should look like after you add the components and modify them.

6. Add some Static Text components to add some description tags to the GUI.

Modify their text by double clicking on the component and changing the String property.

7. Save your GUI wherever you please with your desired filename.


Writing the Code for the GUI Callbacks

8. Open up the .m file that was automatically generated when you saved your GUI.

9. In the MATLAB editor, click on the icon (f), which will bring up a list of the functions within the .m file.

Select popupmenu1_Callback.

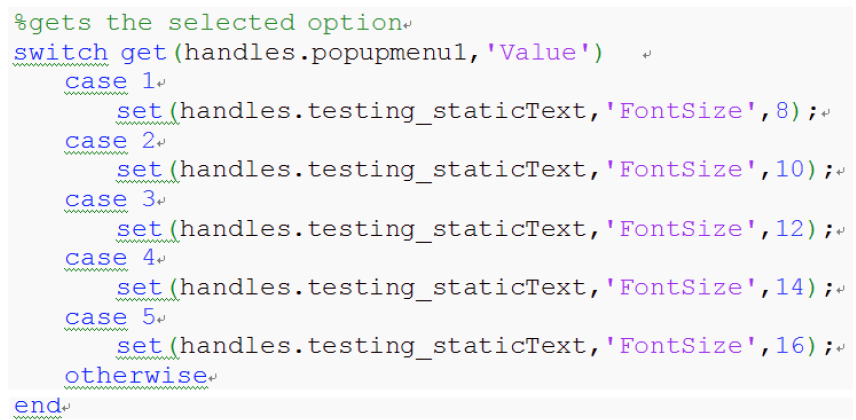
10. Add the following code to the function:

Copy and paste the code

switch get (handles.popupmenu1, ‘Value’)
case 1
set(handles.testing_staticText,’FontSize’,8);
case 2
set(handles.testing_staticText,’FontSize’,10);
case 3
set(handles.testing_staticText,’FontSize’,12);
case 4
set(handles.testing_staticText,’FontSize’,14);
case 5
set(handles.testing_staticText,’FontSize’,16);
otherwise
end

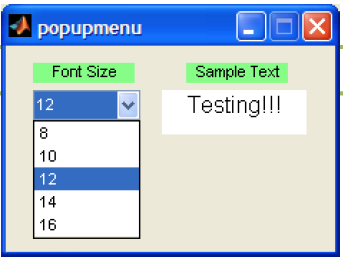
11) You can click BUTTON PLAY on the to launch the GUI.

Go ahead and try selecting different font sizes.

END

Basic GUI (Slider)

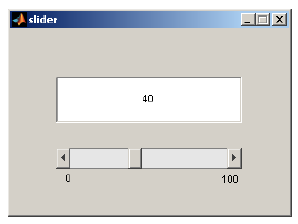
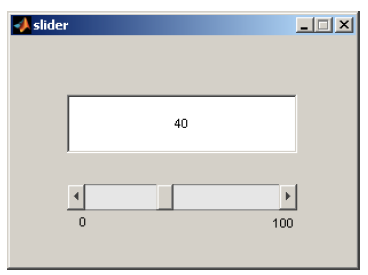
Final GUI for this tutorial

Initializing GUIDE (GUI Creator)

1. Open up MATLAB. Go to the command window and type in guide

2. Choose the first option Blank GUI (Default)

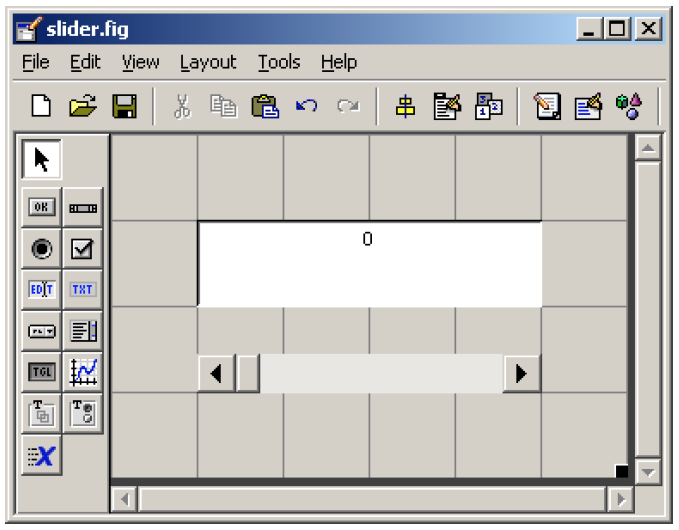
3. You should now see the following screen.

4. For the adder GUI, we will need the following components

Add an Edit Text component to the GUI figure.

Add a Slider component onto the GUI figure.

5. Edit the properties of these components.

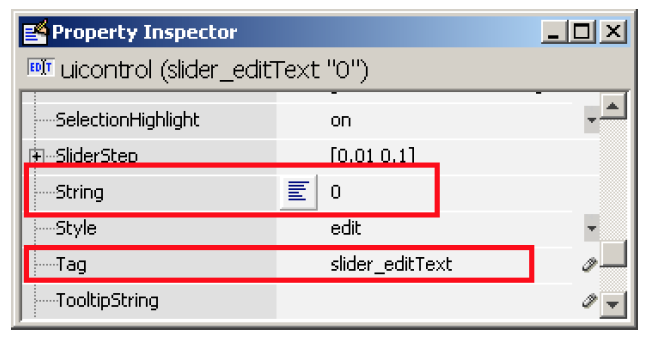
Double click the Edit Text component to bring up the Property Inspector.

Change the String property to 0, and change the Tag property to slider_editText.

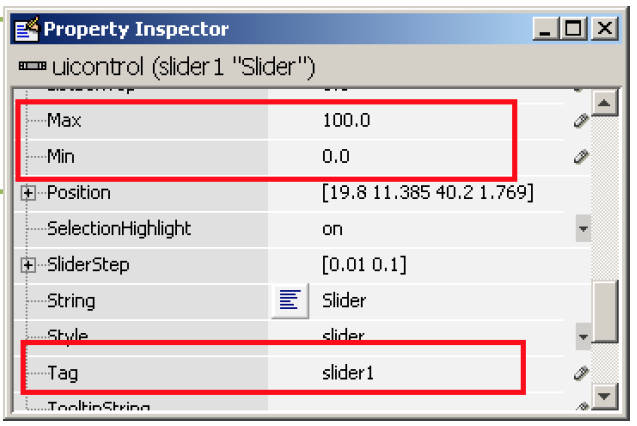
6. Modify the properties of the Slider component.

Sit the Min property to 0, and the Max property to 100.

Change the Tag property to slider1.

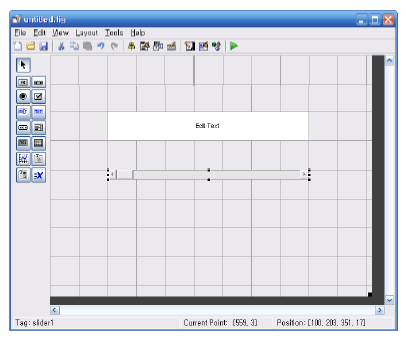
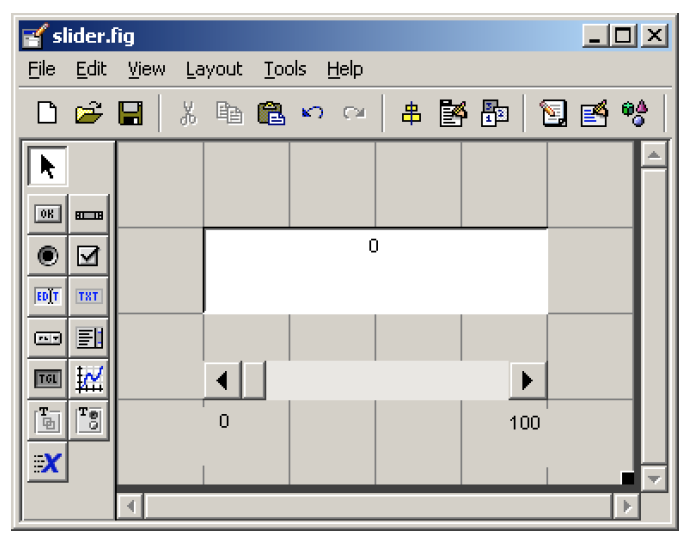
7. The figure should look like after you add the components and modify them.

8. Add some Static Text components to specify the min and max values of the slider.

Modify their text by double clicking on the component and changing the String property.

It’s not required, but I highly recommend it.

9. Save your GUI wherever you please with your desired filename.


Writing the Code for the GUI Callbacks

10. Open up the .m file that was automatically generated when you saved your GUI.

11. In the MATLAB editor, click on the icon, which will bring up a list of the functions within the .m file.

Select slider1_Callback.

12. Add the following code to the function:

Copy and paste the code

sliderValue = get(handles.slider1, ‘Value’);
set(handles.slider_editText, ‘String’, num2str(sliderValue));
guidata(hObject, handles);

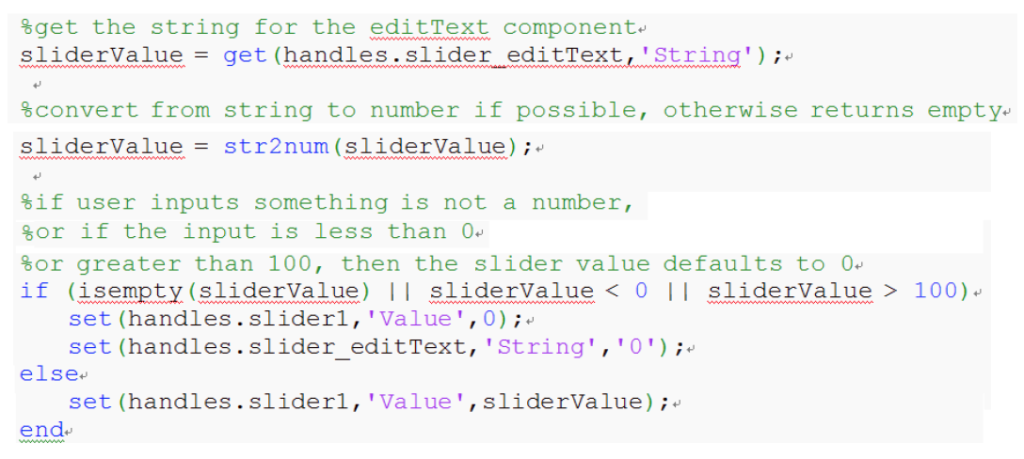
13. Add the following code to the slider_editText_Callback function:

Copy and paste the code

sliderValue = get(handles.slider_editText, ’String’);
sliderValue = strnum(sliderValue);
if (isempty(sliderValue) || sliderValue < 0 || sliderValue > 100)
set (handles.slider1, ‘Value’,0);
set (handles.slider_editText, ‘String’,’0’);
else
   set (handles.slider1,’Value’,sliderValue);
end 

14. From the GUIDE editor, you can click BUTTON PLAY on the to launch the GUI.

15. Now, try to put in different types of inputs to test the GUI. Any input that is not a number, less than zero, or greater than 100 should default the slider to a value of zero.

END

Basic GUI (Text field & button)

Final GUI for this tutorial

Initializing GUIDE (GUI Creator)

1. Open up MATLAB. Go to the command window and type in guide

2. Choose the first option Blank GUI (Default)

3. You should now see the following screen.

4. Before adding components blindly, it is good to have a rough idea about how you

want the graphical part of the GUI to look like.

5. For the adder GUI, we will need the following components

  • Two Edit Text components
  • Four Static Text component
  • One Pushbutton component

6. Edit the properties of these components.

Double click one of the Static Text components. You should see the property Inspector.

7. Do the same for the next Static Text component, but instead of changing the String parameter to +, change it to =, and another it to MyAdderGUI.

8. For Static Text component 0, modify the Tag parameter to answer_staticText.

9. You should have something that looks like the following:

10. Modify the Edit Text components. Double click on the first Edit Text component.

Set the String parameter to 0.

Change the Tag parameter to input1_editText

11. The second Edit Text component, set the String parameter to 0

Set the Tag parameter input2_editText.

12. Modify the pushbutton component.

Change the String parameter to Add!

Change the Tag parameter to add_pushbutton.

13. You should have something like this:

14. Save your GUI under any file name you please. I chose to name mine myAdder.

When you save this file, MATLAB automatically generates two files:

myAdder.fig and myAdder.m.

The .fig file contains the graphics of your interface.

The .m file contains all the code for the GUI.


Writing the Code for the GUI Callbacks

15. Open up the .m file that was automatically generated when you saved your GUI.

In the MATLAB editor, click on the icon (f), which will bring up a list of the functions within the .m file. Select input1_editText_Callback.

16. The cursor should take you to the following code block:

17. Add the following code to the bottom of that code block:

18. Add the same block of code to input2_editText_Callback.

Copy and paste the code.

Input = str2num(get(hObject, ‘String’));
if (isempty(Input))
set (hObject, ‘String’, ‘0’)
end

19. Now we need to edit the add_pushbutton_Callback.

Here is the code that we will add to this callback:

Copy and paste the code.

a = get (handles.input1_editText, ’String’);
b = get (handles.input2_editText, ’String’);
total = str2num(a) + str2num(b);
c = num2str(total);
set(handles.answer_staticText, ‘String’,c);

Launching the GUI

20. There are two ways to launch your GUI.

The first way: Press the icon on the GUIDE editor.

The second way : Launch the GUI from the MATLAB command prompt.

Type in the name of the GUI at the command prompt.

The GUI should start running immediately:

END